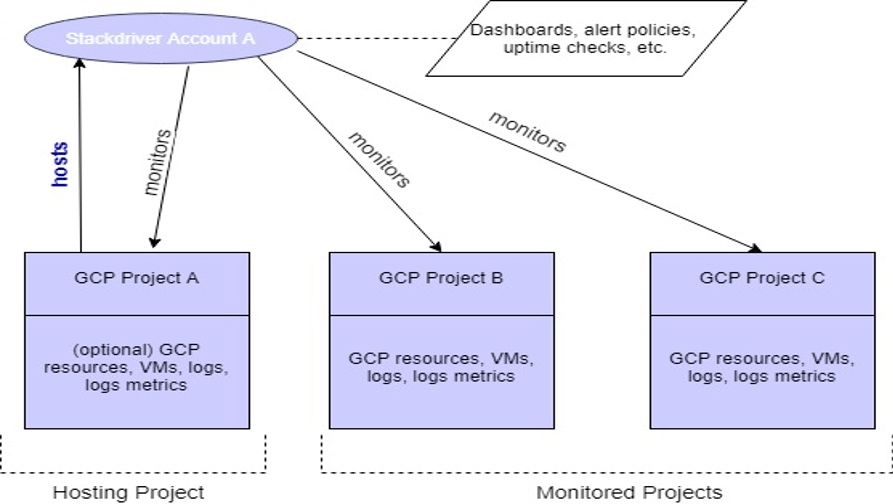
Cloud Operations and Monitoring on GCP
Srinivasa Rao • April 23, 2020
How to build operations and support on google cloud?
1 Introduction
There are 2 terms that mainly go with any system; Reliability and Availability. They both are closely related. Reliability is how the system going to provide the service continuously. Reliability is a probability, specifically, the probability that a system will be able to process some specified workload for some period of time. Availability is a measure of the percentage of time that a system is available and able to perform well under specified workload. The difference between reliability and availability is important to keep in mind when thinking about metrics and service-level agreements (SLAs).
This blog will focus on reliability from a reliability engineering perspective. That is, how do we design, monitor, and maintain services so that they are reliable and available.
2 Improving Reliability with Stackdriver
Google Cloud Platform offers Stackdriver, a comprehensive set of services for collecting data on the state of applications and infrastructure. Specifically, it supports three ways of collecting and receiving information.
2.1 Monitoring
This service is used to help understand performance and utilization of applications and resources. Monitoring collects the basic data about a wide array of resource characteristics and their performance over time.
2.2 Logging
Logging collects messages about specific events related to application and resource operations. Logging to Stackdriver is automatic for most of the GCP resources like Big query, dataflow and so on, but requires installing its agent and setup on some of the resources like the compute engine.
2.3 Alerting
This service is used to notify responsible parties about issues with applications or infrastructure that need attention. Together, these three components of Stackdriver provide a high degree of observability into cloud systems.
Alerting evaluates metric data to determine when some predefined conditions are met, such as high CPU utilization for an extended period of time.
3 Stackdriver Logging
Stackdriver Logging is a centralized log management service. Logs are collections of messages that describe events in a system. Unlike metrics that are collected at regular intervals, log messages are written only when a particular type of event occurs. Some examples of log messages are:
● New account is created on VM and root privileges granted on the computer engine.
● Big Query connection failed because of authentication issues.
● Dataflow job started.
● Dataflow job succeeded/failed.
Stackdriver provides the ability to store, search, analyze, and monitor log messages from a variety of applications and cloud resources. An important feature of Stackdriver Logging is that it can store logs from virtually any application or resource, including GCP resources, other cloud resources, or applications running on premises. The Stackdriver Logging API accepts log messages from any source.
Logs can be easily exported to BigQuery for more structured SQL-based analysis and conducting trend analyses for logs extending past 30 days.
Applications and resources can create a large volume of log data. Stackdriver Logging will retain log messages for 30 days. If we would like to keep logs for longer, then we need to export them to Cloud Storage or BigQuery.
Logs can also be streamed to Cloud Pub/Sub if you would like to use third-party tools to perform near real-time operations on the log data.
3.1 Types of logging
● System Events
● Application events
● Service events
● Security Audit events
● Resource related events
3.2 Kinds of messages
● Performance and uptime
● Informational
● Debugging related
● Failures and Errors
● Access related information and exceptions
4 Monitoring with Stackdriver
Monitoring is the practice of collecting measurements of key aspects of infrastructure and applications. Examples include average CPU utilization over the past minute, the number of bytes written to a network interface, and the maximum memory utilization over the past hour. These measurements, which are known as metrics, are made repeatedly over time and constitute a time series of measurements.
4.1 Metrics
Metrics have a particular pattern that includes some kind of property of an entity, a time range, and a numeric value.
GCP has defined metrics for a wide range of entities, including the following:
■ GCP services, such as BigQuery, Cloud Storage, and Compute Engine.
■ Operating system and application metrics which are collected by Stackdriver agents that run on VMs.
■ External metrics including metrics defined in Prometheus, a popular open source monitoring tool.
In addition to the metric name, value, and time range, metrics can have labels associated with them. This is useful when querying or filtering resources that you are interested in monitoring.
4.2 Time Series
A time series is a set of metrics recorded with a time stamp. Often, metrics are collected at a specific interval, such as every second or every minute. A time series is associated with a monitored entity.
4.3 Dashboards
Dashboards are visual displays of time series.
Dashboards are customized by users to show data that helps monitor and meet service level objectives or diagnose problems with a particular service. Dashboards are especially useful for determining correlated failures.
Stackdriver provides a predefined set of os dashboards for the services being used. Users can also create a custom dashboard and add charts created with the Metrics Explorer to it.
5 Alerting with Stackdriver
Alerting is the process of monitoring metrics and sending notifications when some custom-defined conditions are met. The goal of alerting is to notify someone when there is an incident or condition that cannot be automatically remediated and that puts service level objectives at risk.
5.1 Policies, Conditions, and Notifications
Alerting policies are sets of conditions, notification specifications, and selection criteria for determining resources to monitor.
Conditions are rules that determine when a resource is in an unhealthy state. Alerting users can determine what constitutes an unhealthy state for their resources. Determining what is healthy and what is unhealthy is not always well defined. For example, we may want to run our instances with the highest average CPU utilization possible, but we also want to have some spare capacity for short-term spikes in workload. (For sustained increases in workload, autoscaling should be used to add instances to handle the persistent extra load.) Finding the optimal threshold may take some experimentation. If the threshold is too high, we may find that performance degrades, and we are not notified. On the other hand, if the threshold is too low, we may receive notifications for incidents that do not warrant our intervention. These are known as false alerts. It is important to keep false alerts to a minimum. Otherwise, engineers may suffer “alert fatigue,” in which case there are so many unnecessary alerts that engineers are less likely to pay attention to them.
5.2 Notification methods
The following notification methods are readily available with GCP:
● Mobile Devices (via Cloud Mobile App)
● PagerDuty Services/Sync
● Slack (individual or channel)
● Webhooks (https)
● Email (groups/individual)
● SMS
6 Data lake monitoring
6.1 Proactive monitoring
It is important that systems are being monitored proactively and identify or forecast the issues before they actually surface. Here are some tools that help in proactive monitoring:
● Dashboards
Some of the dashboards that might require are:
○ Daily, weekly, monthly time series Big Query performance dashboard.
○ Failures over time for Big Query, Dataflow and Dataproc.
○ Dataflow performance metrics over time by job, group and project.
○ Dataproc performance metrics over time job, group and project.
● Metrics Explorer
You can set up and view on-demand custom metrics visualizations. Metrics can also be subjected to custom filtering, grouping and aggregation options.
● Uptime checks
We can check service or application uptimes over time intervals.
● Baseline metrics
Collect baseline metrics on resources we need to monitor and compare it with current metrics. Adjust baseline metrics from time to time.
● Alerts
Setup some alerts to help monitoring GCP resources proactively. Example of setting up alerts on performance of BigQuery queries. These are just kind of informational and warning kind of stuff.
It is also a good idea to create baseline metrics (and update them time-to-time) and compare current metrics with baseline metrics gives some idea how systems are performing currently and overtime.
6.2 Reactive monitoring
Reactive monitoring is about responding to the incidents and failures that have already occurred. The alerts and notifications for certain performance conditions and failures play an important role in improving system uptime.
6.2.1 Groups
Groups are a combination of resources that can be monitored as a unit. For example, all dataflow jobs that belong to Athena project and based on some criticality.
Groups simplify setting up alerts on various resources.
6.2.2 Big Query
Since BigQuery is a service, the service and infrastructure level issues are internal to GCP. We will not be notified over those issues. There may be outage alerts if any GCP services are down and not available for a particular period of time. We are mainly concerned about the below issues with BigQuery.
| Alert name | Description | Metrics | Thresholds and Conditions | Notifications |
|---|---|---|---|---|
| alert_bigquery_{dataset}_queryperformance | If query performance reaches n sec 50th percentile then send notification. | Query Execution Time | Aligner: 50th percentileAlignment Period: 1 mThreshold: n s | Email Group:Pager Group:Slacker Group |
| alert_bigquery_failures | If there are any errors in stackdriver logs with bigquery, send notification. Based on how it logs we may need to add more filters. Eg. exceeded quota limits. | Not metric based. Need to find out on how to filter logs | Alignment Period: 1 m Or instance | Email Group:Pager Group:Slacker Group: |
6.2.3 Data Flow
Dataflow jobs can be monitored using its own UI for troubleshooting individual jobs. Dataflow also adds messages to stackdriver like when job status, when started, failed and so on. This document only covers alerting from stackdriver.
We can also setup notifications, custom messages from within dataflow jobs which are not covered here.
| Alert name | Description | Metrics | Thresholds and Conditions | Notifications |
|---|---|---|---|---|
| Alert_dataflow_{group or dataflow job}_elapsedtime | If elapsed time in any dataflow job goes above this time, notification will be sent | Elapsed Time | Period: 1 h | Email Group: ServiceNow: |
| Alert_dataflow_{group or dataflow job}_failed | If the dataflow job fails, notification will be sent | Failed | Alignment Period: 1 m Or instance | Email Group: ServiceNow: |
There are other metrics like vCpus used, number of nodes and so on which are helpful for debugging but no alerting is required on those.
6.2.4 Dataproc
There are a bunch of metrics available for monitoring dataproc. Some of them are HDFS Capacity, running jobs, job duration, connections, CPU Load, Operations running, Memory Usage, Errors, Failed Jobs and Failed Requests.
| Alert name | Description | Metrics | Thresholds and Conditions | Notifications |
|---|---|---|---|---|
| alert_dataproc_{group or dataproc job}_elapsedtime | If elapsed time in any dataproc job goes above this time, notification will be sent | Job Duration | Period: 1 h | Email Group: ServiceNow: |
| alert_dataflow_{group or dataproc job}_failed | If the dataproc job fails, notification will be sent | Errors, Failed Jobs and Failed Request | Alignment Period: 1 m | Email Group: ServiceNow: |
6.2.5 Composer
Stackdriver provides metrics for monitoring Composer under two Resource Types, Cloud Composer Environment and Cloud Composer Workflows. Some metrics do overlap between the two resource types. The main metrics to monitor Composer include Tasks, Tasks Duration, Workflow duration and Runs. There are also some metrics to understand the overall health of the environments.
6.2.6 GCS Buckets
There are quite few metrics available with GCP storage. Some of them are Object count, bytes received, requests and so on.
We don't need to set up any direct alerts on the GCP buckets. But when there are any errors with GCP buckets, it will be alerted indirectly like dataflow and so on.
6.2.7 Compute Engine
Here are some sample alerts you can setup on compute engine instance.
| Alert name | Description | Metrics | Thresholds and Conditions | Notifications |
|---|---|---|---|---|
| alert_gce_{group or instance name}_uptime | If uptime is less than 100%, then notification to be sent. | uptime | Period: 1 m Threshold: < 100 % | Email Group: ServiceNow: |
| Alert_gce_{group or instancename}_sftp_uptime | If SFTP service uptime on a monitoring instance is < 100%, notification to be sent. | uptime | Period: 1 m Threshold: < 100 % | Email Group: ServiceNow: |
6.2.8 Quotas and Limits
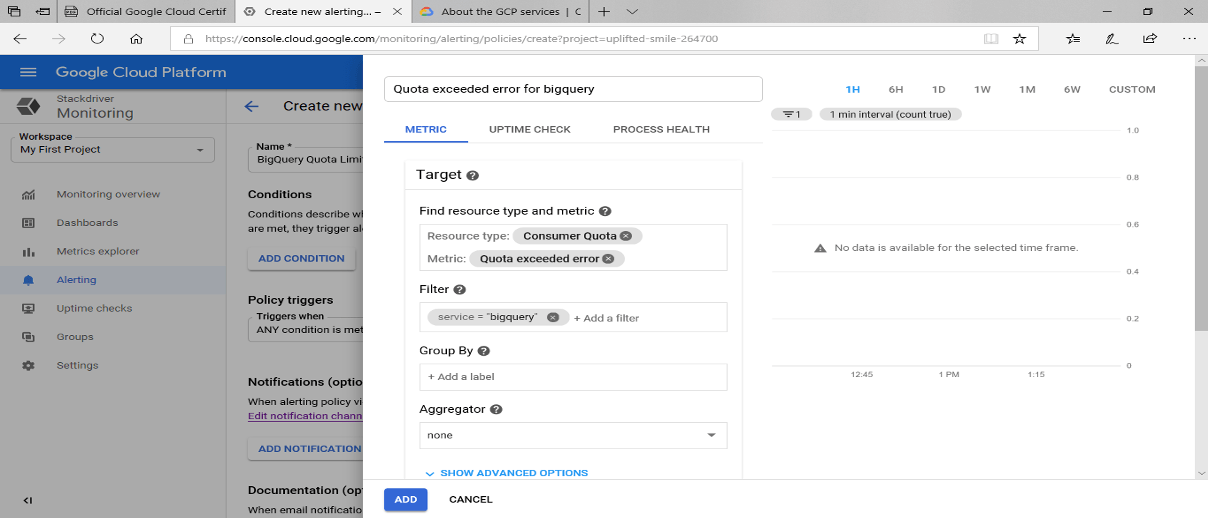
The following metrics are available under resource type “Consumer Quota” for monitoring “Quotas and Limits” for Google cloud resources like BigQuery, Cloud storage and so on.
| Metric | Description | Alert |
|---|---|---|
| Allocation quota usage | The total consumed allocation usage | The total consumed is above 90% compared to the Quota limit, warning messages may be sent to support groups. |
| Quota Exceeded Error | The error happened when the quota limit was exceeded. | Need alert notification on this. |
| Quota limit | The limit for the quota | Can be part of the “Quota and Limits” dashboard. |
| Rate Quota usage | Total consumed rate quota | Can be part of the “Quota and Limits” dashboard. |
Sample screen on how to set up alerts on Quotas and Limits:
6.3 Troubleshooting (Log Search)
It's used to debug and troubleshoot issues from time to time. For example, Tableau group report issue connecting to Big Query. It could be an issue with Big Query itself or network issue or security issue.
7 Logging Pipeline messages
We can use the Dataflow SDK's built-in logging infrastructure to log information during pipeline's execution. The following url has more detailed information and coding samples.
https://cloud.google.com/dataflow/docs/guides/logging
8 Additional Monitoring Tools
The following are some of the tools available on GCP for troubleshooting applications and services deeper. At this time, these tools may not be relevant to our data lake monitoring.
8.1 Stackdriver debugger
The Stackdriver debugger allows us to inspect and analyze the state of the particular applications in real time without having to stop the application. With the debugger, we will be able to capture the call stack and variables without slowing down the application; this is particularly helpful if we want to debug or trace the code and understand its behavior. Stackdriver does this by capturing the application state by means of debug snapshots, which add less than 10 ms to the latency:
8.2 Stackdriver profiler
The Stackdriver profiler helps gather CPU usage and memory allocation information from the applications. This is different than Stackdriver monitoring, because with the Stackdriver profiler, we can tie the CPU usage and memory allocation attributes back to the application's source code. This helps us identify parts of your application that consume the most resources and also allows us to check the performance of your code.
8.3 Stackdriver Trace
Stackdriver Trace is a distributed tracing system that collects latency data from applications, Google App Engine, and HTTP(s) load balancers, and displays it in near-real time in the GCP console. For applications to be able to use this feature, they need to have the appropriate code in place with the Stackdriver Trace SDKs, but this is not needed if our application is being deployed in Google App Engine. Stackdriver Trace greatly enhances the understanding of how the application behaves. Things like time to handle requests and complete RPC calls can be viewed in real time using Stackdriver Trace.
9 Cloud Audit Logs
Cloud Audit Logs maintains three audit logs for each Google Cloud project, folder, and organization: Admin Activity, Data Access, and System Event. Google Cloud services write audit log entries to these logs to help us answer the questions of "who did what, where, and when?" within your Google Cloud resources.
9.1 Admin Activity audit logs
Admin Activity audit logs contain log entries for API calls or other administrative actions that modify the configuration or metadata of resources. For example, these logs record when users create VM instances or change Cloud Identity and Access Management permissions.
9.2 Data Access audit logs
Data Access audit logs contain API calls that read the configuration or metadata of resources, as well as user-driven API calls that create, modify, or read user-provided resource data.
This feature is disabled by default and must be enabled to be utilized. Due to the volume of logs that can be generated, all publicly accessible objects in the project are exempt from this audit logging.
9.3 System Event audit logs
System Event audit logs contain log entries for Google Cloud administrative actions that modify the configuration of resources. System Event audit logs are generated by Google systems; they are not driven by direct user action.
9.4 Access Transparency logs
Viewing query text, table names, dataset names, and dataset access control lists might not generate Access Transparency logs; this access pathway gives read-only access. Viewing query results and table or dataset data will still generate Access Transparency logs. In the same way, viewing message payloads will still generate Access Transparency logs for PubSub topics. Viewing topic names, subscription names, message attributes, and timestamps might not generate Access Transparency logs; this pathway gives read-only access.
Only people who are allowed to view this log information can be granted roles/logging.privateLogViewer (Private Logs Viewer).
10 Appendix A - Dashboards
10.1 Performance over time
We need to create dashboards that will show us how Big Query queries, Dataflow and Dataproc jobs are performing.
Users should be able to choose the time period and compare the metrics.
11 APPENDIX III - Notifications and Service system Integration
The following are the notification methods that are in-built and readily available in GCP.
● Mobile Devices (via Cloud Mobile App)
● PagerDuty Services/Sync
● Slack (individual or channel)
● Webhooks (https)
● Email (groups/individual)
● SMS
You can integrate the ticketing systems like ServiceNow to create alerts and support specific tickets and to monitor the resolution status. Whenever an alert happens, The GCP notification system needs to call serviceNow API and post alert specific information.
This is can be achieved using the following options available on the GCP:
Option I : using webhooks
Currently GCP allows only static webhooks with basic and token-based authentication. This is very basic and may not satisfy complex needs.
Option II: using pub/sub
This is more flexible and allows any type of notification methods like POST API calls and so on. This also allows multiple notification methods in a single call. The messages also can be logged into BigQuery for later analysis. But this requires little more effort and incur additional costs.
The author has extensive experience in Big Data Technologies and worked in the IT industry for over 25 years at various capacities after completing his BS and MS in computer science and data science respectively. He is certified cloud architect and holds several certifications from Microsoft and Google. Please contact him at srao@unifieddatascience.com if any questions.

Database types Realtime DB The database should be able to scale and keep up with the huge amounts of data that are coming in from streaming services like Kafka, IoT and so on. The SLA for latencies should be in milliseconds to very low seconds. The users also should be able to query the real time data and get millisecond or sub-second response times. Data Warehouse (Analytics) A data warehouse is specially designed for data analytics, which involves reading large amounts of data to understand relationships and trends across the data. The data is generally stored in denormalized form using Star or Snowflake schema. Data warehouse is used in a little broader scope, I would say we are trying to address Data Marts here which is a subset of the data warehouse and addresses a particular segment rather than addressing the whole enterprise. In this use case, the users not only query the real time data but also do some analytics, machine learning and reporting. OLAP OLAP is a kind of data structure where the data is stored in multi-dimensional cubes. The values (or measures) are stored at the intersection of the coordinates of all the dimensions.

This blog puts together Infrastructure and platform architecture for modern data lake. The following are taken into consideration while designing the architecture: Should be portable to any cloud and on-prem with minimal changes. Most of the technologies and processing will happen on Kubernetes so that it can be run on any Kubernetes cluster on any cloud or on-prem. All the technologies and processes use auto scaling features so that it will allocate and use resources minimally possible at any given time without compromising the end results. It will take advantage of spot instances and cost-effective features and technologies wherever possible to minimize the cost. It will use open-source technologies to save licensing costs. It will auto provision most of the technologies like Argo workflows, Spark, Jupyterhub (Dev environment for ML) and so on, which will minimize the use of the provider specific managed services. This will not only save money but also can be portable to any cloud or multi-cloud including on-prem. Concept The entire Infrastructure and Platform for modern data lakes and data platform consists of 3 main Parts at very higher level: Code Repository Compute Object store The main concept behind this design is “Work anywhere at any scale” with low cost and more efficiently. This design should work on any cloud like AWS, Azure or GCP and on on-premises. The entire infrastructure is reproducible on any cloud or on-premises platform and make it work with some minimal modifications to code. Below is the design diagram on how different parts interact with each other. The only pre-requisite to implement this is Kubernetes cluster and Object store.
Spark-On-Kubernetes is growing in adoption across the ML Platform and Data engineering. The goal of this blog is to create a multi-tenant Jupyter notebook server with built-in interactive Spark sessions support with Spark executors distributed as Kubernetes pods. Problem Statement Some of the disadvantages of using Hadoop (Big Data) clusters like Cloudera and EMR: Requires designing and build clusters which takes a lot of time and effort. Maintenance and support. Shared environment. Expensive as there are a lot of overheads like master nodes and so on. Not very flexible as different teams need different libraries. Different cloud technologies and on-premises come with different sets of big data implementations. Cannot be used for a large pool of users. Proposed solution The proposed solution contains 2 parts, which will work together to provide a complete solution. This will be implemented on Kubernetes so that it can work on any cloud or on-premises in the same fashion. I. Multi-tenant Jupyterhub JupyterHub allows users to interact with a computing environment through a webpage. As most devices have access to a web browser, JupyterHub makes it easy to provide and standardize the computing environment of a group of people (e.g., for a class of data scientists or an analytics team). This project will help us to set up our own JupyterHub on a cloud and leverage the cloud's scalable nature to support large groups of users. Thanks to Kubernetes, we are not tied to a specific cloud provider. II. Spark on Kubernetes (SPOK) Users can spin their own spark resources by creating sparkSession. Users can request several executors, cores per executor, memory per executor and driver memory along with other options. The Spark environment will be ready within a few seconds. Dynamic allocation will be used if none of those options are chosen. All the computes will be terminated if they’re idle for 30 minutes (or can be set by the user). The code will be saved to persistent storage and available when the user logs-in next time. Data Flow Diagram
Data Governance on cloud is a vast subject. It involves lot of things like security and IAM, Data cataloging, data discovery, data Lineage and auditing. Security Covers overall security and IAM, Encryption, Data Access controls and related stuff. Please visit my blog for detailed information and implementation on cloud. https://www.unifieddatascience.com/security-architecture-for-google-cloud-datalakes Data Cataloging and Metadata It revolves around various metadata including technical, business and data pipeline (ETL, dataflow) metadata. Please refer to my blog for detailed information and how to implement it on Cloud. https://www.unifieddatascience.com/data-cataloging-metadata-on-cloud Data Discovery It is part of the data cataloging which explained in the last section. Auditing It is important to audit is consuming and accessing the data stored in the data lakes, which is another critical part of the data governance. Data Lineage There is no tool that can capture data lineage at various levels. Some of the Data lineage can be tracked through data cataloging and other lineage information can be tracked through few dedicated columns within actual tables. Most of the Big Data databases support complex column type, it can be tracked easily without much complexity. The following are some examples of data lineage information that can be tracked through separate columns within each table wherever required. 1. Data last updated/created (add last updated and create timestamp to each row). 2. Who updated the data (data pipeline, job name, username and so on - Use Map or Struct or JSON column type)? 3. How data was modified or added (storing update history where required - Use Map or Struct or JSON column type). Data Quality and MDM Master data contains all of your business master data and can be stored in a separate dataset. This data will be shared among all other projects/datasets. This will help you to avoid duplicating master data thus reducing manageability. This will also provide a single source of truth so that different projects don't show different values for the same. As this data is very critical, we will follow type 2 slowly changing dimensional approach which will be explained my other blog in detail. https://www.unifieddatascience.com/data-modeling-techniques-for-modern-data-warehousing There are lot of MDM tools available to manage master data more appropriately but for moderate use cases, you can store this using database you are using. MDM also deals with central master data quality and how to maintain it during different life cycles of the master data. There are several data governance tools available in the market like Allation, Collibra, Informatica, Apache Atlas, Alteryx and so on. When it comes to Cloud, my experience is it’s better to use cloud native tools mentioned above should be suffice for data lakes on cloud/

